
Quality of Life Analysis in San Antonio
Krishna Panthi, Micheaux Simmons, Frank Yang, AJ Garner
School of Computing, Clemson Universitykpanthi@clemson.edu
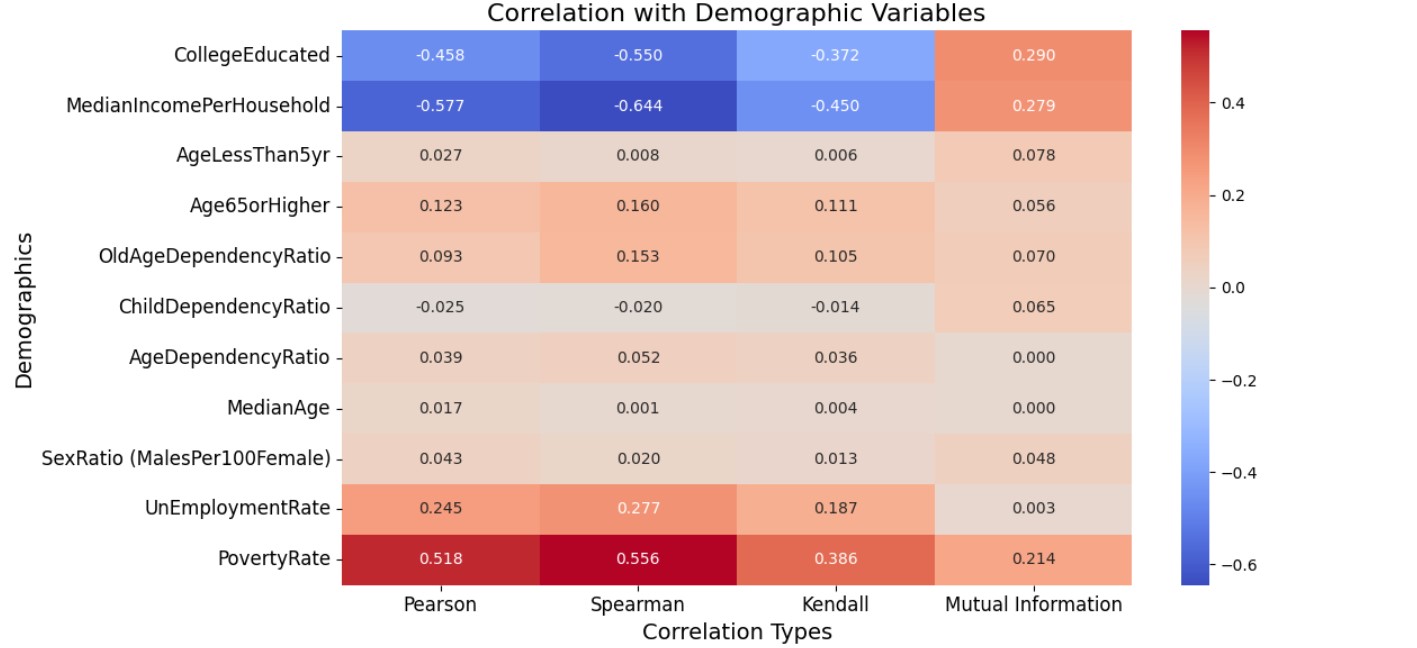
Figure 1: Heatmap showing correlation between number of events reported per 1000 people and various demographic variables for each census tract.
Summary
This project represents a collaborative effort between the Better Future Institute (BFI) of San Antonio and Clemson University. The primary dataset consisted of 311 non-emergency service requests collected over a 14-month period, which was provided to the research team. This dataset was subsequently enriched with demographic and socio-economic data for San Antonio, sourced from the U.S. Census Bureau, to facilitate a comprehensive analysis. A key component of the analysis involved conducting regression analyses to examine the correlation between service request patterns and the integrated demographic and socio-economic variables. Furthermore, we implemented predictive modeling to forecast the response time for a given service request. These models incorporated various factors, including historical response times for similar requests, geographical location, date, and time of the request, amongst other relevant parameters. Read the full paper for detailed analyses.Brief Data Description
San Antonio, located in South Texas and serving as the county seat of Bexar County, is the focus of this comprehensive study. The analysis utilizes two primary data sources:
311 Customer Service Data:
- Time period: 2023-09-01 to 2024-10-29
- Coverage: 14 months (14 CSV files)
- Records: 553,887
- Variables: 44 columns
- Geographic scope: 375 census tracts in Bexar County
Census Bureau Data (per census tract):
- College-educated population count
- Median household income
- Total population
- Children under 5 years
- Population aged 65+
- Old age dependency ratio
- Child dependency ratio
- Age dependency ratio
- Median age
- Unemployment rate
- Sex ratio (males per 100 females)
- Poverty rate
Outcomes
The analysis reveals significant correlations between socioeconomic factors and 311 service request patterns in San Antonio:
- Higher frequency of service requests correlates with increased poverty rates, lower education levels, and reduced median incomes
- Response time analysis indicates potential service delivery disparities based on income levels
- Random forest modeling shows promise for response time prediction
- Findings support data-driven resource allocation and service delivery improvements
Further research incorporating additional data sources is recommended for a more comprehensive understanding of quality of life issues in San Antonio.
Detailed results and outcome are presented in the paper.